
SMA 강봉으로 체결된 T-stub의 에너지소산능력
Copyright ⓒ 2014 by Korean Society of Steel Construction
초록
축방향 인장력을 받는 T-stub은 T-stub과 긴결재의 재료적 물성 특성, T-stub의 기하학적 형상, 긴결재의 직경과 체결력 등의 변화에 의하여 상이한 거동특성을 나타낸다. 이러한 변화의 영향으로 T-stub은 T-stub 플랜지의 휨항복 후 소성파괴, T-stub 필릿부의 휨항복과 긴결재 파단, 긴결재의 파단 등과 같은 세 가지 파괴양상을 나타낸다. 일반적으로 T-stub 플랜지의 두께가 얇고 긴결재의 게이지 거리가 긴 T-stub은 플랜지의 휨항복 후 소성화에 의하여 T-stub 플랜지의 두께가 두껍고 긴결재의 게이지 거리가 짧은 T-stub보다 에너지소산능력이 우수하다. 이 연구는 T-stub 체결에 사용된 긴결재가 T-stub의 에너지소산능력에 미치는 영향을 파악하기 위하여 3차원 비선형 유한요소해석을 진행하였다. T-stub 해석모델의 긴결재로는 F10T-M20 고장력볼트와 Ø19.05mm(3/4inch)인 SMA 강봉을 모델링하였고, T-stub의 기하학적 형상은 T-stub 필릿부의 휨항복과 긴결재 파단의 파괴를 나타내도록 선택하였다.
Abstract
The T-stub subjected to an axial tensile force shows various behavior characteristics according to the changes in the diameter and tightening force of the fastener, the geometric shape of the T-stub, and the material properties of the T-stub and fastener. Due to the influence of these changes, the T-stub shows three failure modes: plastic failure after the flexural yielding of the T-stub flange, flexural yielding of the T-stub fillet, and fracture of the fastener. In general, a T-stub with a thin flange and where the gauge distance of the fastener is long has a larger energy dissipation capacity than a T-stub with a thick flange and where the gauge distance of the fastener is short, due to the plastic deformation after flexural yielding. In this study, three-dimensional nonlinear finite element analysis was carried out to determine the effect of the fastener used for fastening the T-stub on the energy dissipation capacity of the T-stub. For the fastener of the T-stub analysis model, F10T-M20 high-tension bolts and Ø19.05-mm (3/4-inch) SMA bars were modeled, and the geometric shape of the T-stub was selected to represent the flexural yielding of the T-stub fillet and the axial tensile failure of the fastener.
키워드:
T-stub, 에너지 소산 능력, SMA 강봉, F10T-M20 고장력볼트, 3차원 비선형 해석Keywords:
T-stub, Energy dissipation capacity, SMA bars, F10T high-tension bolts, Three-dimensional nonlinear finite element analysis1. 서 론
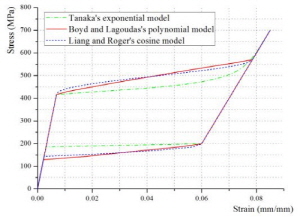
SMA(shape memory alloy)는 오스테나이트(austenite)와 마르텐자이트(martensite)의 상변화에 의하여 뛰어난 형상기억능력과 초탄성복원능력을 나타내는 신재료이며, 와이어, 강봉, 댐퍼의 형태로 건축 및 토목 강구조물에 적용하여 에너지소산능력을 증가시켜 내진성능을 향상시킬 수 있다. 일반적으로 SMA는 형상합금의 배합, 오스테나이트와 마르텐자이트의 온도에 따라서 Fig. 1 및 Fig. 2와 같은 형상기억능력과 복원능력에 대한 응력-변형도-온도 관계 곡선을 나타낸다. 즉, Fig. 1은 SMA의 현재온도가 마르텐자이트의 최종온도 Mf보다 작은 경우에 하중 가력과 제하에 따른 SMA의 형상복원능력을 나타낸다. 또한, Fig. 2는 SMA의 현재온도가 오스테나이트의 최종온도 Af보다 큰 경우에 하중 가력과 제하에 따른 SMA의 초탄성복원능력을 나타낸다[1]. SMA의 1차원 구성방정식모델은 Tanaka[2], Liang and Rogers[3], Auricchio and Sacco[4] 등이 제안하였다. Tanaka는 SMA의 오스테나이트와 마르텐자이트의 상변화를 지수경화법칙(exponential hardening rule)을 적용하여 파악하였고, 상변화 중 재료특성은 변화하지 않고 일정하다고 주장하였다. Liang과 Rogers는 오스테나이트와 마르텐자이트의 상변화를 코사인경화법칙(cosine hardening rule)을 적용하여 파악하였고, Tanaka와 같이 상변화 중 재료특성은 변화하지 않고 일정하다고 주장하였다.

Auricchio와 Sacco는 오스테나이트와 마르텐자이트의 상변화를 선형경화법칙(linear hardening law)를 적용하여 파악하였다. SMA의 3차원모델 구성방정식은 Liang and Rogers[5], Boyd and Lagoudas[6], Auricchio et al.[7] 등이 제안하였다. Liang과 Rogers은 J2-형태 변형 위상면(J2-type trans-formation surface)에 근거하여 1차원 구성방정식모델을 발전시켜서 3차원 구성방정식모델을 제안하였다. Boyd와 Lagoudas는 J2-형태 변형 위상면를 적용하여 오스테나이트에서 마르텐자이트로의 상변화를 설명하였고, 다항식경화함수(polynomial hardening function)를 적용하였다. Auricchio et al.은 Auricchio와 Sacco의 연구를 발전시켰고, 의사탄성변형을 설명하기 위하여 Drucker-Prager 형태 위상면(Drucker-Prager-type surface)을 고려하였다.
SMA는 댐퍼, 와이어 혹은 강봉의 형상으로 최근 건축구조물의 접합부에 적용이 시도되고 있다. Speicher et al.[8]은 NiTi SMA 강봉을 적용한 기둥-보 접합부상세를 제안하였고, 이러한 접합부의 복원능력을 파악하는 실험적 연구를 수행하였다. DesRoches et al.[9]은 반복하중을 받는 SMA 와이어와 SMA 강봉의 재료적 거동특성을 파악하였고, SMA 와이어가 SMA 강봉보다 복원능력이 우수하기 때문에 건축구조물에 더 유용하다는 것을 밝혔다. Tamai and Kitagawa[10]는 SMA 와이어의 초탄성거동 파악 및 내진능력 향상을 위한 건축구조물의 적용성을 검토하였다. Abolmaali et al.[1]은 SMA 강봉으로 체결된 T-stub의 이력거동을 파악하였다.
이 연구는 반복하중을 받는 T-stub의 이력거동에 영향을 미치는 여러 가지 요인 중 긴결재의 영향을 파악하기 위하여 진행하였다. 즉 T-stub 체결에 사용된 긴결재가 T- stub의 에너지소산능력에 미치는 영향을 파악하고자 3차원 비선형 유한요소해석을 수행하였다. T-stub 해석모델의 긴결재로는 F10T-M20 고장력볼트와 Ø19.05mm(3/4inch)인 SMA 강봉을 선택하여 모델링하였고, T-stub의 기하학적 형상은 T-stub 필릿부의 휨항복과 긴결재 파단의 파괴를 나타내도록 선택하였다.
2.축방향 인장력을 받는 T-stub의 3차원 비선형 유한요소해석
2.1 T-stub 유한요소 해석모델
축방향 인장력을 받는 T-stub의 에너지소산능력을 파악하기 위하여 6개의 해석모델을 모델링하여 3차원 비선형 유한요소해석을 수행하였다. 해석에 있어서 적용된 T-stub 강재와 F10T-M20 고장력볼트의 재료적 물성값은 Table 1, Table 2에 정리하였다[11]. SMA 강봉의 재료적 물성값은 Table 3에 정리하였다[12]. Table 3에 정리한 것과 같이 상변화 온도가 저온인 SMA 강봉을 선택한 이유는 SMA의 현재온도 T가
 값이 1.0보다 상대적으로 큰 값을 갖는 T-stub 접합부는 T-stub 플랜지의 휨항복 후 소성변형에 의하여 에너지소산능력이 영향을 받는다.
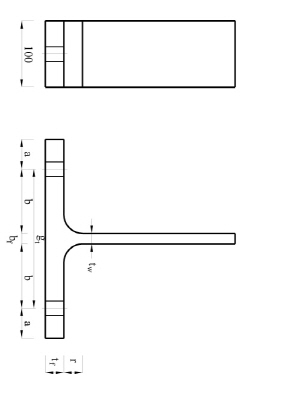
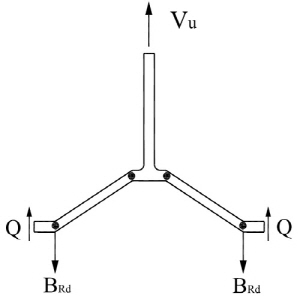
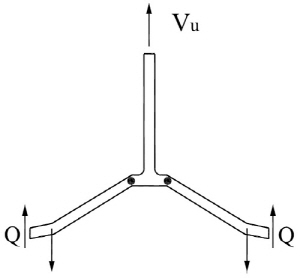
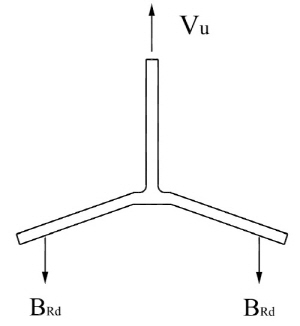
그러나 α'값이 1.0보다 작거나 근방의 값을 갖는 T-stub 접합부는 T-stub 플랜지 필릿부의 휨항복 혹은 플랜지에 체결된 긴결재에 의하여 에너지소산능력이 영향을 받는다. 따라서 Fig. 3과 Table 4에 나타난 것과 같이 T-stub 해석모델의 기하학적 형상은 T-stub 필릿부의 휨항복과 긴결재 파단 파괴양상이 나타나도록 유도하였다. 이를 위하여 Kulak et al.[13], Thornton[14], Astaneh-Asl[15] 등이 제안한 아래의 식 (1)과 같은 α'값이 α'=0.68, 1.61,3.63를 선택하였다. 각각의 T-stub 접합부의 값의 변화에 따른 파괴양상은 Fig. 4와 같이 예측할 수 있다.
 (1)
(1)
여기서,
 (2)
(2)
 (3)
(3)
 (4)
(4)
 (5)
(5)
 (6)
(6)
Table 4에 정리한 것과 같이 3차원 비선형 유한요소해석모델링에 있어서 T-stub 플랜지의 두께는
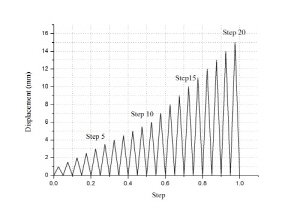
 210mm로 선택하였다. F10T-M20 고장력볼트는 87kN의 고장력볼트 축력이 발생하도록 초기장력을 가하는 것으로 모델링하였고, Ø19.05mm(3/4inch) SMA 강봉도 87kN의 축력이 발생하도록 초기장력을 가하는 것으로 모델링하였다. 전체 T-stub 해석모델은 상용프로그램인 ABAQUS(ver. 10.1.03)를 이용하여 모델링하였다. T-stub, F10T-M20 고장력볼트, 너트, 와셔 등은 C3D8R(eight-node brick element with reduced integration)을 부재요소와 C3D8(eight-node brick element)을 부재요소를 적용하여 검토한 결과 거동양상, 응력분포, 에너지소산능력 등에 큰 차이가 발생하지 않았기 때문에 해석시간을 고려하여 해석수행의 속도가 빠른 C3D8R 부재요소를 선택하여 해석을 수행하였다. 그러나 SMA 강봉은 User Subroutine에서 C3D8R 부재요소를 지원하지 않아서 C3D8 부재요소를 선택하여 해석을 수행하였다. 해석 시에 각 부재 사이의 접촉 및 지압현상, 긴결재의 초기장력도 포함하여 해석하였다. 해석 시에 적용한 ABAQUS 옵션은 Table 5와 같다. 하중은 Fig. 5과 같은 변위 조건으로 T-stub 스템의 끝단에 축방향 인장력 형태로 가하였다. 각 부재 사이의 미끄럼계수는 0.3로 선택하였다. 전체 T-stub 해석모델은 약 8,800개의 부재와 약 6,000개의 절점으로 구성되었다.
SMA는 오스테나이트(austenite)와 마르텐자이트(mar-tensite)의 재료적 위상변화에 따라서 아래 Fig. 6과 같은 응력-변형도 관계 곡선을 나타낸다. 이러한 응력-변형도 관계 곡선을 예측하기 위한 SMA의 구성방정식모델은 대표적으로 Lagoudas모델과 Auricchio모델이 있다. 이 연구에서는 Lagoudas 구성방정식모델을 적용하였다.
Lagoudas 구성방정식모델에서 적용한 에너지방정식은 아래의 식 (7)과 같다.
 (7)
(7)
2.2 T-stub 유한요소 해석결과
T-stub 해석모델의
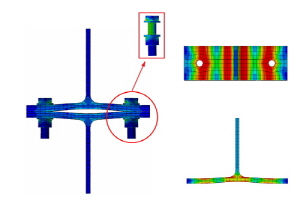
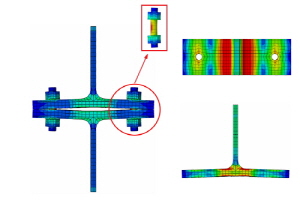
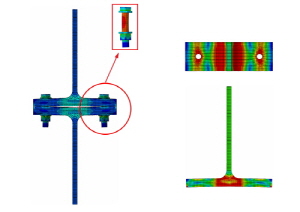
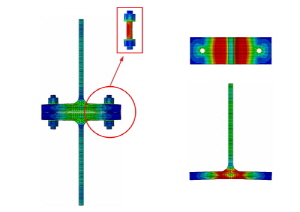
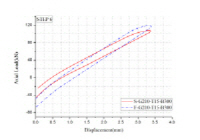
 0.68인 F-G210-T28-B300 해석모델과 S-G210-T28- B300 해석모델은 긴결재와 T-sub 접촉부의 응력집중현상은 F-G210-T21-B300 해석모델과 S-G210-T21-B300 해석모델보다 적게 나타났고, 필릿부 응력집중 현상은 뚜렷이 나타났다. 이 경우에 긴결재인 F10T-M20 고장력볼트와 ∅19.05mm(3/4inch) SMA 강봉도 응력집중 현상이 발생하였으나 항복응력은 초과하지 않았기에 인장파단이 발생하지 않은 것으로 판단할 수 있다. Fig. 7, Fig. 8, Fig. 9에 나타난 것과 같이 T-sub은 휨항복 후 플랜지 혹은 필릿부의 소성힌지가 보 형태 파괴형상(beam-type failure)을 나타내었다.
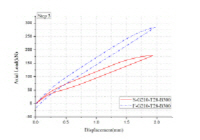
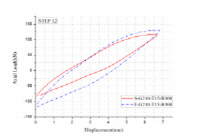
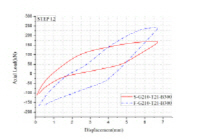
T-stub 유한요소해석을 통하여 얻은 T-stub의 이력곡선은 Fig. 10와 같다. Table 6에 정리한 것과 같이
 값이 클 때보다 더 효과적인 것을 알 수 있다.
2.3 T-stub의 에너지소산능력 평가
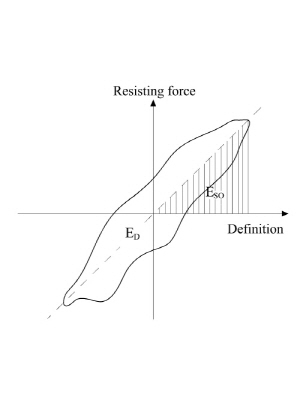
T-stub 해석모델의 하중-변위 이력곡선의 내부면적에 해당하는 에너지소산능력은 식 (8)과 같은 등가점성감쇠계수(eq-uivalent viscous damping factor)을 적용하여 무차원화하였다.
 (8)
(8)
Fig. 11은 각 싸이클 당 에너지소산과 등가점성감쇠계수와의 관계를 나타낸다. Table 7에 정리된 것과 같이
 의 값이 작은 T-stub 플랜지에 체결된 SMA 강봉은 초탄성복원능력이 우수하기 때문에 잔류변형의 영향이 없었고 인장파단도 발생하지 않았다.
3. 결 론
이 연구는 F10T 고장력볼트 및 SMA 강봉을 적용한 축방향 인장력을 받는 T-stub의 에너지소산능력을 비교하기 위하여 진행하였다. 이 연구를 통하여 다음과 같은 결론을 얻었다.
(1)
 0.68, 1.61, 3.63인 F10T 고장력볼트 및 SMA 강봉으로 체결된 T-stub은 예측한 것과 같이 T-stub 플랜지의 휨항복에 의하여 파괴되었다. 그러나 예측한 F10T 고장력볼트나 SMA 강봉의 파단은 발생하지 않았다.
(2)
 값이 작은 T-stub의 에너지소산은 T-stub 플랜지의 휨항복의 영향보다 SMA 강봉의 영향을 더 받는다.
(3)SMA 강봉은
 값이 작은 Type II 형태의 파괴양상을 나타내는 T-stub에 사용하는 것이 에너지소산능력을 더 발휘하여 효과적이다.
기 호
 :고장력볼트 초기장력
 )
)
 :하중-변위 관계 곡선의 내부 면적에 해당하는 특정 싸이클의 소산된 에너지
 )
)
 : 특정 싸이클의 최대 변형에너지
 )
)
 )
)
 : 온도
: 온도
 : 기준온도
 :고장력볼트 중심축과 T-stub 플랜지 끝 단 사이의 거리(mm)
 :고장력볼트 중심축과 T-stub 스템 면 사이의 거리(mm)
 : T-stub 플랜지 폭(mm)
 : 고장력볼트의 직경(mm)
 : 고장력볼트 구멍의 직경(mm)
 : T-stub의 고장력볼트 게이지 거리(mm)
 : 고장력볼트의 피치(mm)
 : 필릿 반경(mm)
 : T-stub 플랜지의 두께(mm)
 : T-stub 웨브의 두께(mm)
 :특정 두께에 대한 고장력볼트가 받는 인장강도를 극대화 하거나 주어진 고장력볼트가 받는 인장강도에 필요한 두께를 최소화 하는 값
 : 강재의 인장 변형률
 : Cauchy 응력 텐서
 : 변환 변형률 텐서
 : 마르텐자이트 분율(부피비)
Acknowledgments
이 연구는 한국연구재단(과제번호: NRF-2013R1A2A2A0 7067970)과 인하대학교의 지원에 의하여 수행된 과제의 일부이다. 이에 논문의 저자들은 감사의 말씀을 전한다.
References
-
Abolmaali, A., Treadway, J., Aswath, P., Lu. F.K., and McCarthy, E. (2006) Hysteresis Behavior of T-Stub Connections with Superelastic Shape Memory Fasteners, Journal of Constructional Steel Research, Elsevier, Vol.62, No.8, pp.831-838.
[https://doi.org/10.1016/j.jcsr.2005.11.017]

- Tanaka, K. (1986) A Thermomechanical Sketch of Shape Memory Effect: One-Dimensional Tensile Behavior, Res Mechanica, Vol.18, No.3, pp.251-263.
-
Liang, C., and Rogers, C.A. (1990) One-Dimensional Thermomechanical Constitutive Relations for Shape Memory Materials, Res Mechanica, Sage, Vol.1, No.2, pp.207-234.
[https://doi.org/10.1177/1045389X9000100205]
-
Auricchio, F., and Sacco, E. (1997) A One-Dimensional Model for Superelastic Shape-Memory Alloys with Different Elastic Properties Between Austenite and Martensite, International Journal of Non-Linear Mechanics, Elsevier, Vol.32, No.6, pp.1101-1114.
[https://doi.org/10.1016/S0020-7462(96)00130-8]
-
Liang, C., and Rogers, C.A. (1992) A Multi-Dimensional Constitutive Model for Shape Memory Alloys, Journal of Engineering Mathematics, Springer, Vol.26, No.3, pp.429-443.
[https://doi.org/10.1007/BF00042744]
-
Boyd, J.G., and Lagoudas, D.C. (1996) A Thermodynamical Constitutive Model for Shape Memory Materials, Part I: The Monolithic Shape Memory Alloy, International Journal of Plasticity, Elsevier, Vol.12, No.6, pp.805-842.
[https://doi.org/10.1016/S0749-6419(96)00030-7]
-
Auricchio, F., Taylor, R.L., and Lubliner, J. (1997) Shape-Memory Alloys: Macromodelling and Numerical Simulations of the Superelastic Behavior, Computer Methods in Applied Mechanics and Engineering, Elsevier, Vol.146, pp.281-312.
[https://doi.org/10.1016/S0045-7825(96)01232-7]
-
Speicher, M.S., DesRoches, R., and Leon, R.T. (2011) Experimental Results of a NiTi Shape Memory Alloy (SMA)-Based Recentering Beam-Column Connection, Engineering Structures, Elsevier, Vol.33, No.9, pp.2448-2456.
[https://doi.org/10.1016/j.engstruct.2011.04.018]
-
DesRoches, R., McCormick, J., and Delemont, M. (2004) Cyclic Properties of Superelastic Shape Memory Alloy Wires and Bars, Journal of Structural Engineering, American Society of Civil Engineers, Vol.130, No.1, pp.38-46.
[https://doi.org/10.1061/(ASCE)0733-9445(2004)130:1(38)]
-
Tamai, H., and Kitagawa, Y. (2002) Pseudoelastic Behavior of Shape Memory Alloy Wire and Its Application to Seismic Resistance Member for Building, Computational Materials Science, Elsevier, Vol.25, pp.218-227.
[https://doi.org/10.1016/S0927-0256(02)00266-5]
- 한국강구조학회(2011) 강구조설계(개정판), 구미서관.KSSC (2012) Steel Structure Design (Revised Edition), Goomiseogwan, Korea (in Korean).
- SAES Getters Group (n.d.) SAES Smart Materials, Memry Corporation, http://www.shape-memory-alloys.com
- Kulak, G.L., Fisher, J.W., and Struik, J.H.A. (2001) Guide to Design Criteria for Bolted and Riveted Joints (2nd Ed.), American Institute of Steel Construction, USA.
- Thornton, W.A. (1985) Prying Action: A General Treatment, Environmental Engineering, American Institute of Steel Construction, Vol.22, No.2, pp.67-75.
- Astaneh-Asl, A. (1985) Procedure For a Design and Analysis of Hanger-Type Connections, Engineering Journal, American Institute of Steel Construction, Vol.22, No.2, pp.63-66.


 )
)
 )
)
 )
)

 11mm)
11mm)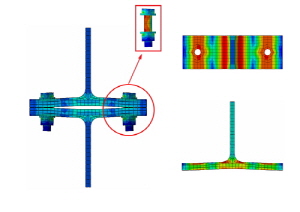
 10mm)
10mm) by Step
 )
)
 )
) 7mm)
7mm)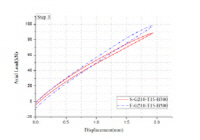


 by Step

